London rents in August 2026: figures for journalists
Each month FTR London publishes the London Rent Index, which presents the Office for National Statistics’ Price Index of Private Rents for London and every borough. The figures below are ready to quote, each with its period and source.
ONS figures for August 2026, published . Next update after the ONS release on .
Key figures, August 2026
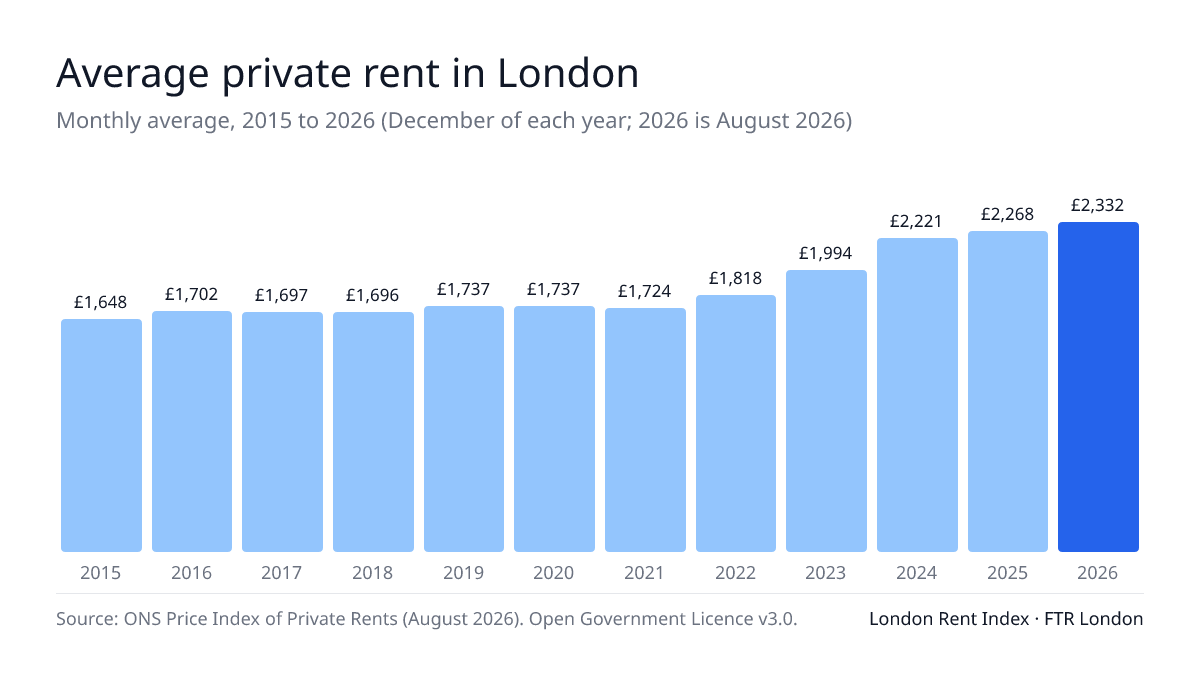
The average private rent in London was £2,332 a month in August 2026, +3.5% on a year earlier (ONS Price Index of Private Rents).
ONS figure
A one-bedroom home in London rented for an average of £1,760 a month in August 2026, and a two-bedroom home for £2,232 (ONS).
ONS figure
London's average rent of £2,332 compares with £1,459 for England as a whole in August 2026 (ONS).
ONS figure
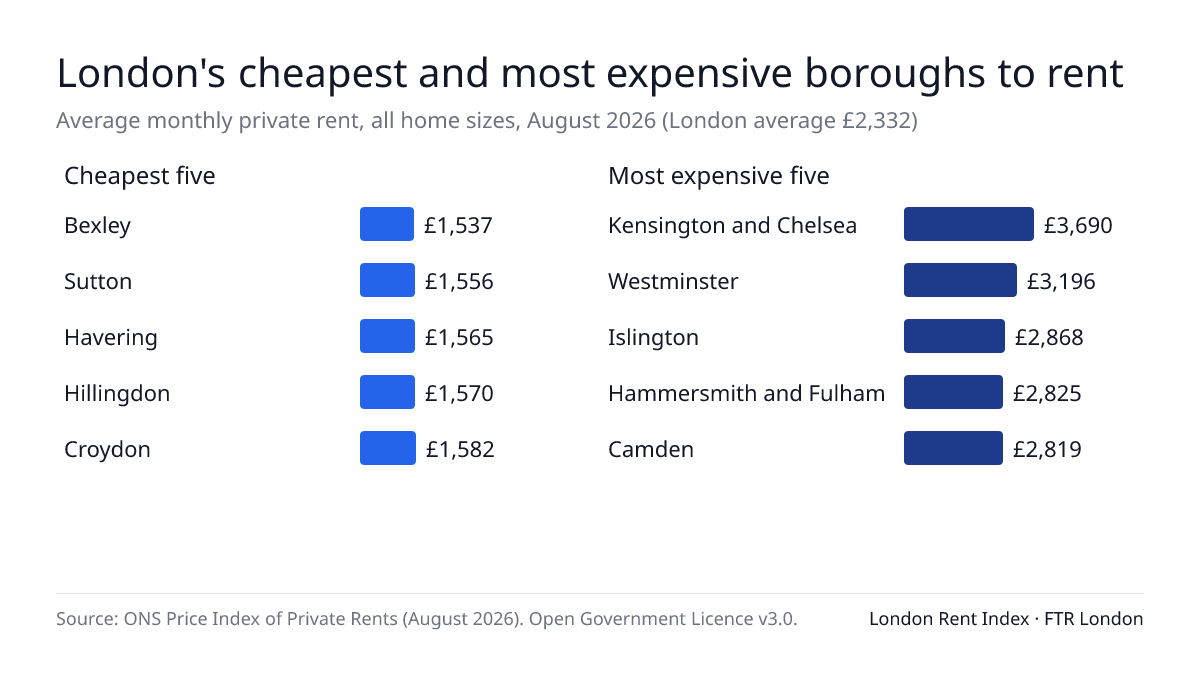
Bexley was London's cheapest borough to rent in August 2026, at an average of £1,537 a month; Kensington and Chelsea was the most expensive, at £3,690 (London Rent Index on FTR London, ranking of ONS borough figures).
FTR London calculation from ONS data
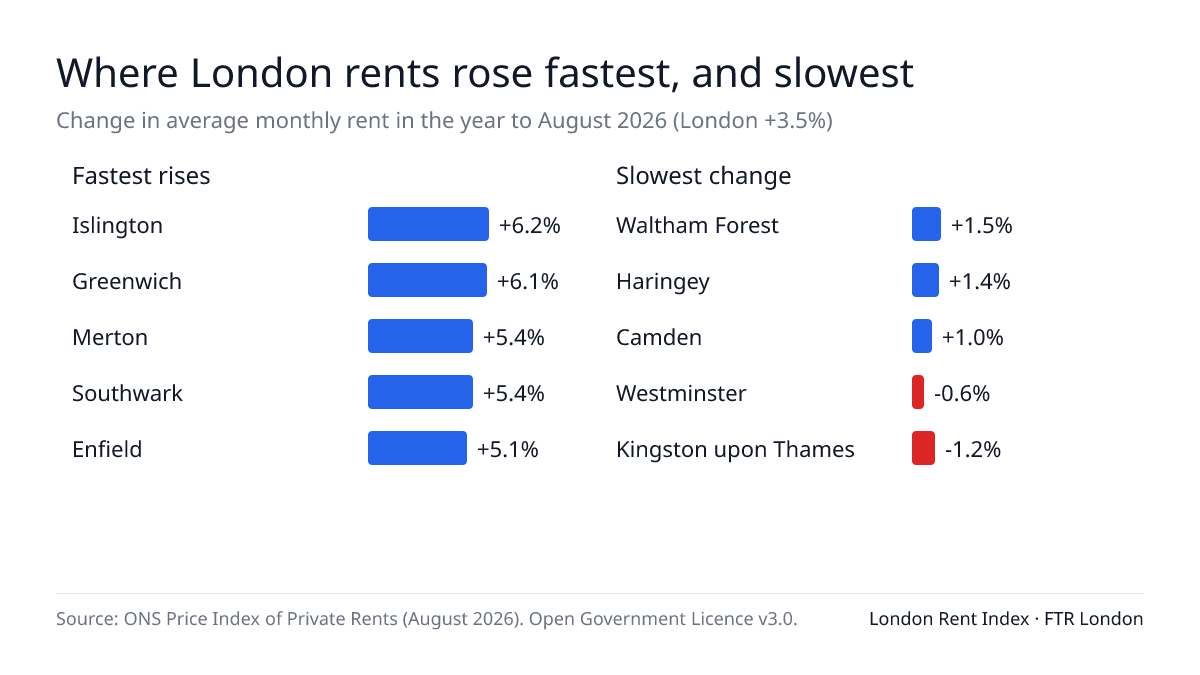
Rents rose fastest in Islington (+6.2%) and Greenwich (+6.1%) in the year to August 2026 (ONS; ranking by FTR London).
FTR London calculation from ONS data
Two London boroughs saw average rents fall in the year to August 2026: Westminster (−0.6%) and Kingston upon Thames (−1.2%) (ONS).
ONS figure
London's average rent has risen from £1,735 in January 2021 to £2,332 in August 2026, up £597 a month or 34.4% (FTR London calculation from the ONS series).
FTR London calculation from ONS data
Measured against what people living there earn, Kensington and Chelsea is London's least affordable borough: the average rent takes 86.2% of median gross full-time pay, against 40.6% in Bromley and 63.1% across London (rents: ONS, August 2026; pay: ONS Annual Survey of Hours and Earnings, 2024, by place of residence; calculation by FTR London).
FTR London calculation from ONS and ASHE data
What these figures are
The rents are the ONS average monthly private rent across all existing and new tenancies, not asking rents for homes advertised today, which run higher. Where a line says ‘FTR London calculation’, we have ranked, compared or combined published ONS figures; we have not added data of our own. The affordability figures divide the average rent by median gross full-time pay for people living in each borough, before tax, from the ONS Annual Survey of Hours and Earnings for 2024, which lags the rent data.
Every borough, bedroom count and property type is on the London Rent Index, and the methodology explains what the figures do and do not measure.
Charts
Free to use with the credit shown on each image. Each chart updates with the monthly ONS release; right-click or open the image to save it (1200 × 675 pixels, PNG).
Data downloads
- Latest month for London and every borough (CSV)
- Monthly average rent since January 2015 (CSV)
- Contains public sector information licensed under the Open Government Licence v3.0. Licensed under the Open Government Licence v3.0.
How to cite
London Rent Index, FTR London, using ONS Price Index of Private Rents data for August 2026. https://ftrlondon.co.uk/rent-index
Please name the ONS as the source of the figures. For a single borough, cite that borough’s page; each has its own citation line.
Media contact
For data queries, a borough or bedroom breakdown not shown here, or to check a figure before publication, email support@ftrlondon.co.uk.
About FTR London
FTR London is a London rental marketplace: landlords list rooms and homes directly, and renters contact them directly.